
 |
 |
 |
 |
 |
 |
Tutorial
 |  |
||||||||||

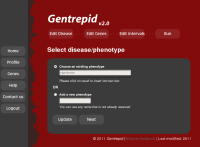
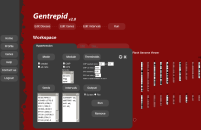
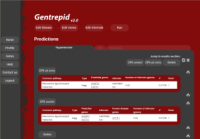
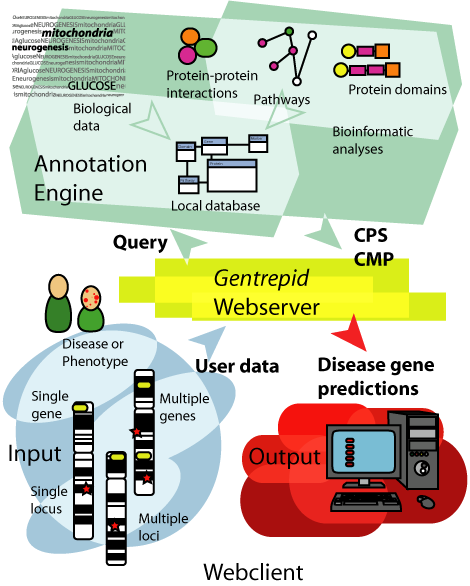
Mouse over the image to get a brief description of the different aspects and functions of the Gentrepid server. Click on the section in the image for a more detailed tutorial. Protein protein interactions have been extracted from I2D Metabolic and signalling pathways have been extracted from KEGG and BioCarta Protein domains have been predicted using the HMMER3.0 with the Pfam library All database queries are via the PostgreSQL server A single phenotype can be chosen to represent the disease. Phenotypes have been curated from OMIM.  Inputs can range from a single locus to multiple genetic loci. A locus can be represented by a marker and either an interval surrounding this marker, a second marker, or as a standalone. In the standalone instance, the adjacent genes are selected as input. In the interval instances, genes within this intervals are selected as input. Markers are represented as either single nucleotide polymorphism (SNPs), cytogenic loci, or an STS band.  The system outputs the list of predicted genes  CPS outputs common pathways and interactions that are enriched in the data CMP outputs common domains that are enriched in the data Genes and proteins are annotated in the local database. These annotations include protein structural information, protein interaction and pathway data, and disease-gene information from OMIM. |
| ||||||||||
 |  |


